
Clear representation of output of confusion matrix
INTRODUCTION
In one of my recent projects — a transaction monitoring system generates a lot of False Positive alerts (these alerts are then manually investigated by the investigation team). We were required to use machine learning to auto close those false alerts. Evaluation criteria for the machine learning model was a metric Negative Predicted Value that means out of total negative predictions by the model how many cases it has identified correctly.
NPV = True Negative / (True Negative + False Negative)
The cost of false-negative is extremely high because these are the cases where our model is saying they are not-fraudulent but in reality, they are fraudulent transactions.
To get into action I would quickly display the confusion_matrix and below is the output from the jupyter notebook. My binary classification model is built with target = 1 (for fraud transactions) so target= 0 (for non fraud).
cm = confusion_matrix(y_test_actual, y_test_pred)
print(cm)----- Output -----
[[230, 33]
 [24, 74]
Depending upon how you interpret the confusion matrix, you can either get an NPV of 90% or 76%. Because —
TN = cm[0][0] or cm[1][1] ie. 230 or 74
FN = cm[1][0] ie. 24
Wikipedia Representation
I referred to confusion matrix representation from Wikipedia.
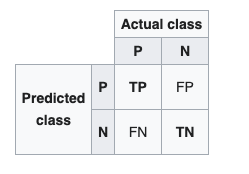
This image from Wikipedia shows that predicted labels are on the horizontal levels and actual labels are on the verticals levels. This implies,
TN = cm[1][1] ie. 76
FN = cm[1][0] ie. 24
NPV = 76%
Sklearn Representation
Scikit learn documentation says — Wikipedia and other references may use a different convention for axes.
Oh Wait! documentation doesn’t mention anything clear, isn’t it? They say Wikipedia and other references may use a different convention for axes.
What do you mean by “may use a different convention for axes”? We have seen that if you use the wrong convention for axes your model evaluation metric may completely go off the track.
If you read through the documentation and towards the bottom you will find this example
tn, fp, fn, tp = confusion_matrix([0, 1, 0, 1], [1, 1, 1, 0]).ravel()Here, they have flattened the matrix output. On our example this implies that,
TN = cm[0][0] ie. 230
FN = cm[1][0] ie. 24
NPV = 90%
UNDERSTANDING THE STRUCTURE OF CONFUSION MATRIX
Clearly understanding the structure of the confusion matrix is of utmost importance. Even though you can directly use the formula for most of the standard metrics like accuracy, precision, recall, etc. Many times you are required to compute the metrics like negative predictive value, false-positive rate, false-negative rate which are not available in the package out of the box.
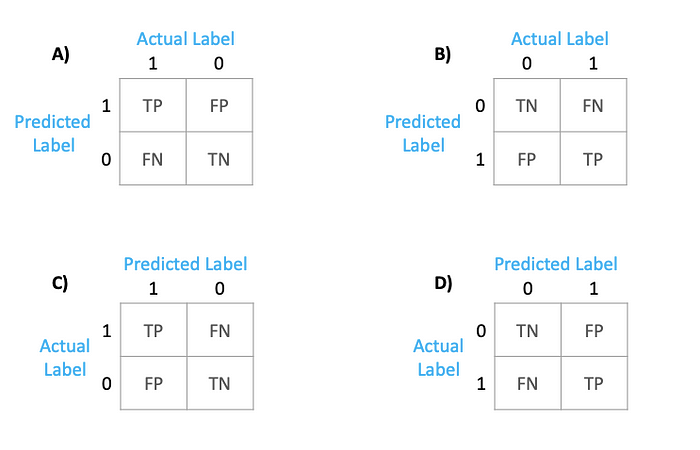
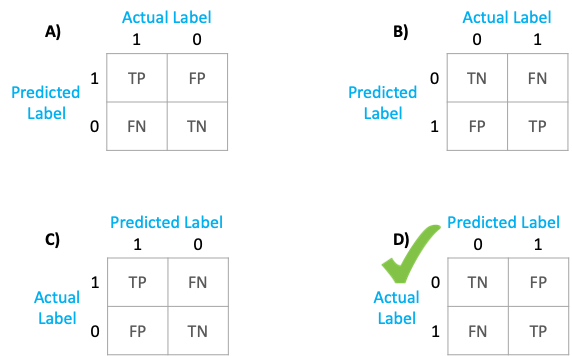
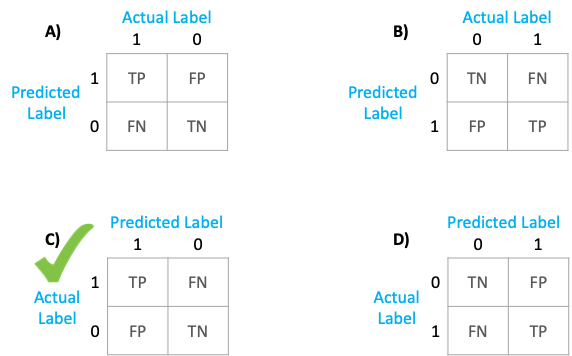
Now, if I ask you to pick the correct option for the confusion matrix that is the output of confusion_matrix. Which one would you pick?
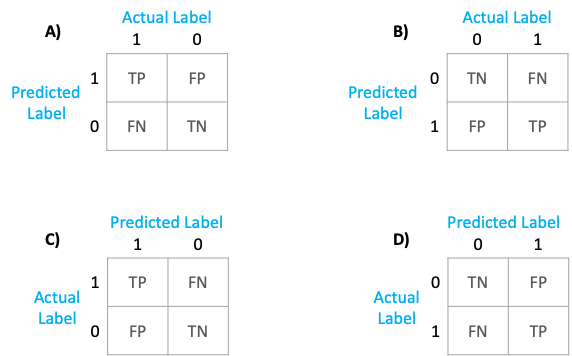
Would your answer be “A” because that’s what Wikipedia says or would it be “C” because sklearn documentation says so?
LET’S FIND OUT
Consider these are your y_true and y_pred values.
y_true = [0, 1, 0, 1, 0, 1, 0]
y_pred = [1, 1, 1, 0, 1, 0, 1]
By looking at the given lists, we can calculate the following:
TP (True Positive) = 1
FP (False Positive) = 4
TN (True Negative) = 0
FN (False Negative) = 2
For your classic Machine Learning Model for binary classification, mostly you would run the following code to get the confusion matrix.
from sklearn.metrics import confusion_matrixconfusion_matrix(y_true, y_pred)

If we fill it back to the confusion matrix, we get the confusion matrix as below
cm = confusion_matrix(y_true, y_pred)
print (cm)--- Output ---
[[0,4]
 [2,1]]which translates to this:             predicted
            0       1
          -----   -----
       0|   0   |   4
actual    -----   -----
       1|   2   |   1
TN (True Negative) = cm[0][0] = 0
FN (False Negative) = cm[1][0] = 2
TP (True Positive) = cm[1][1] = 1
FP (False Positive) = cm[0][1] = 4
However, if you were to add a simple parameter “labels”.
cm = confusion_matrix(y_true, y_pred, labels=[1,0])
print (cm)--- Output ---
[[1,2]
 [4,0]]which translates to this:            predicted
            1       0
          -----   -----
       1|   1   |   2
actual    -----   -----
       0|   4   |   0
TP (True Positive) = cm[0][0] = 1
FP (False Positive) = cm[1][0] = 4
TN (True Negative) = cm[1][1] = 0
FN (False Negative) = cm[0][1] = 2
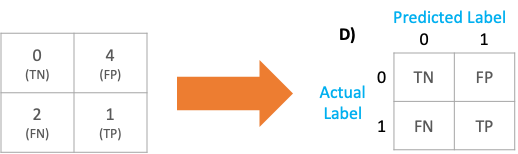
CONCLUSION:
The correct representation of the default output of the confusion matrix from sklearn is below. Actual labels on the horizontal axes and Predicted labels on the vertical axes.
- Default output
#1. Default output
confusion_matrix(y_true, y_pred)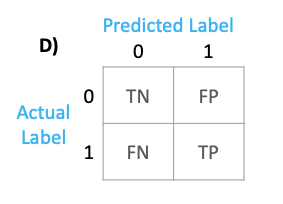
2. By adding the labels parameter, you can get the following output
#2. Using labels parameter
confusion_matrix(y_true, y_pred, labels=[1,0])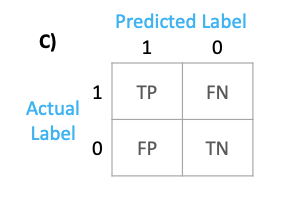
No comments:
Post a Comment